Data-driven Culture: Part III- Metrics and experimentation

Published 10 December 2021
Image of post

In the latest addition to our data-driven culture series, we take a look at metrics and experimentation. As an accelerator, we come across a lot of start-ups that position themselves as data-driven, but we have realized that there is no common understanding of what such positioning means. There is also the misconception that data is complex, abstract and out of reach. This however doesn’t need to be the case.

So what does it mean to have a data-driven culture?

We think there are four key core pillars:

i) Define success and what needs to be measured

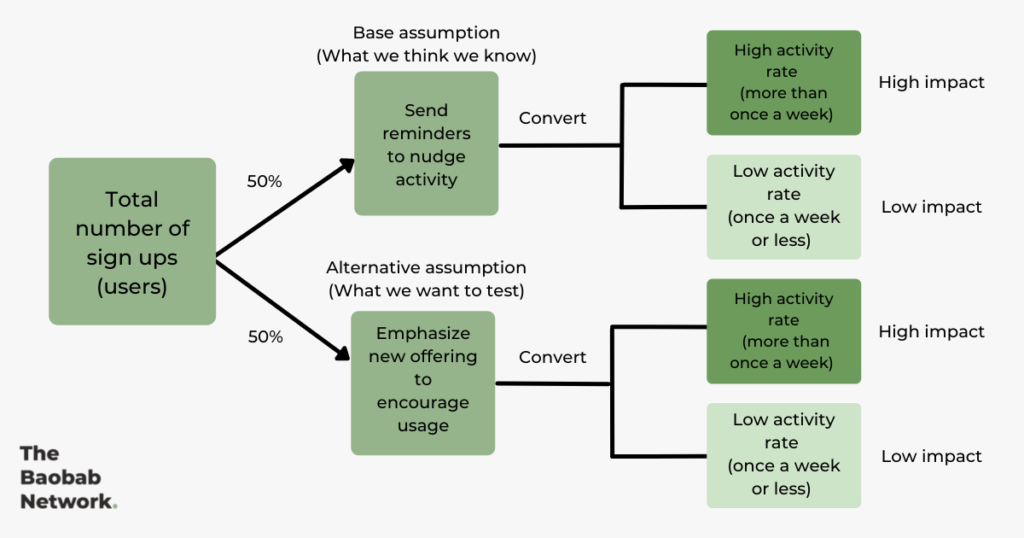
ii) Have a culture of testing and learning 

iii) Take time to design an agile data infrastructure 

iv) Ensure everyone in the team owns data-driven processes

Here, we discuss metrics and experimentation, and will focus on the first two pillars:

Defining success and what needs to be measured 

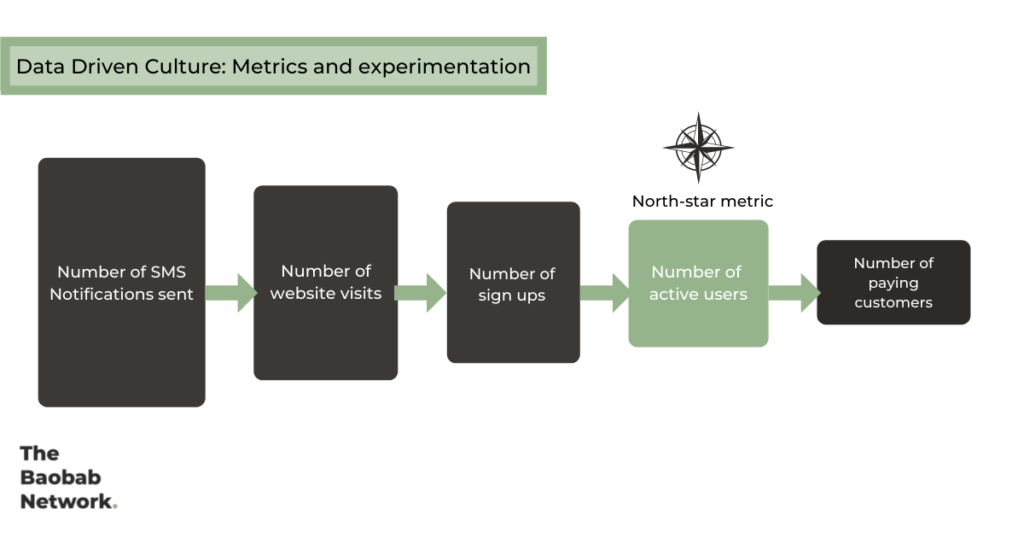
Data-driven start-ups are very intentional about setting the right goals and measuring results. This involves clearly defining what is valued in the company and finding tangible metrics that can articulate this within a specific time frame. To ensure clarity, simplicity and alignment, a team should pick a single “north-star” metric that can be used to measure the start-up’s success. Ideally, your company’s north-star metric ought to be connected to important drivers within the business while also being actionable i.e. the team has the ability to influence the metric.

Here is an example of how a newly launched B2C company could go about identifying a good north-star metric.

The goal: Drive customer acquisition

The drivers: The team was able to collect a list of phone numbers from potential customers when conducting consumer research. They plan to initially send SMS notifications to drive traffic to their website. They expect only a fraction of the people who receive SMS notifications to visit the website, a smaller fraction to sign up, an even smaller fraction to be active users, and only a few would be paying customers.

North-star metric: Number of weekly active users

Rationale: Given that the goal is to drive customer acquisition, the team would want to focus on figuring out their ideal customer and what makes them happy enough to use the platform once a week or more. This understanding of the customer would also enable them to reduce the drop-offs among people who visit the website but don’t sign-up while also figuring out how to best drive traffic towards their website.

Definition of success:  2,000 weekly active users

Notably, a good north-star metric is able to provide focus, enabling the team to work on the things that matter i.e. things that move a company towards its goal. Once a north-star metric is identified, a team can then be able to track it and understand the levers that drive it. Data-driven start-ups embed the north-metric in decision-making processes especially when it comes to product changes, sales efforts and operational structures. Before implementing a new initiative, the team should be able to answer the question- how does this affect our [north-star metric]?

You can find more guidelines on finding the right north-star metric here.

Have a culture of testing and learning 

Once the key metric is clear, it then becomes important to translate your intuition into assumptions that need to be tested. We come across too many start-ups that invest a lot of resources into initiatives that are based on assumptions that aren’t tested, leading to a longer learning curve. One way of ensuring that you instil this test and learn culture is by constantly asking your team three questions before investing time and resources into a new initiative:

  1. i) What are our assumptions? 
  2. ii) How can we test these assumptions? 

iii) What evidence(data) do we need to validate or nullify this assumption? 

The faster you are able to answer these questions and implement appropriate tests, the faster you will get to product-market fit and ultimately grow your company. You can keep these tests very simple and intuitive for everyone to partake in, especially during the early stages where your data is scarce. This can be done by creating tests where you change only one component of your business/product and observe whether it has worked. The core idea is to ensure that you articulate your assumptions and have a clear overview of what’s working, what’s not working and why.

For example, the hypothetical B2C company that we described above can decide to make an attempt of achieving their weekly active user target by launching an initiative where they text users that have signed up, reminding them about the offerings on their website.

The assumption: Registered users were initially interested in the offerings that they saw on the website and just needed a reminder to nudge them into interacting with the platform. If this assumption is not true, we could conclude that registered users weren’t interested in the offerings that they came across during sign-up.

How we can test the assumption: Randomly split the users into two groups and conduct an experiment for 3 weeks:

  • Group 1: send weekly reminders nudging customers to use the platform as is
  • Group 2: send weekly reminders where the framing emphasizes new offerings on your platform

Evidence/Data needed: We can conclude that users just need a reminder if more Group 1 than Group 2 customers visit the site after receiving texts (i.e. higher conversion rate). This can be considered highly significant if Group 1 customers also visit the site more times (i.e. higher activity rates).

Notably, the above experiment is very rudimentary but it creates a foundation for making data-driven decisions without making your team feel dizzy with numbers and complexity. It also sets the scene for better-designed tests in the future. Your team can also conduct other experiments simultaneously, as long as the initiatives are independent of each other. For instance, the team above can safely conduct concurrent tests with SEO marketing. The most important part though is starting small, learning, and then incrementally implementing tests with more thoroughness and scale.

You can learn more about effectively implementing statistically proven tests such as A/B testing here.

Stay tuned for our next piece which will focus on the two pillars that we haven’t discussed:
i) Taking time to design an agile data infrastructure,
ii) Ensuring everyone in the team owns data-driven processes.

Summary

Some of the core pillars of building a data-driven culture include:

  • Define success and what needs to be measured 
    • Determine a single north-star metric that the team can focus on
      • This metric should be simple, actionable, time-bound and connected to other important drivers in the business
      • There should be a clear rationale for why you chose your north-star metric and this should be closely tied to your goals
      • The north-star metric informs the metrics that should be tracked throughout the company
  • Have a culture of testing and learning
    • You can embed a culture of testing and learning by always asking these three questions.
      • What are our assumptions?
      • How can we test these assumptions?
      • What evidence(data) do we need to validate or nullify this assumption?
    • Focus on getting started with testing and learning rather than getting it perfect. You can start with very simple and intuitive tests before refining better quality tests.
      • The simplest rule to follow is to only test one component at a time during a test.
      • You can run different tests at a time as long as the components that you are testing are independent of each other.